
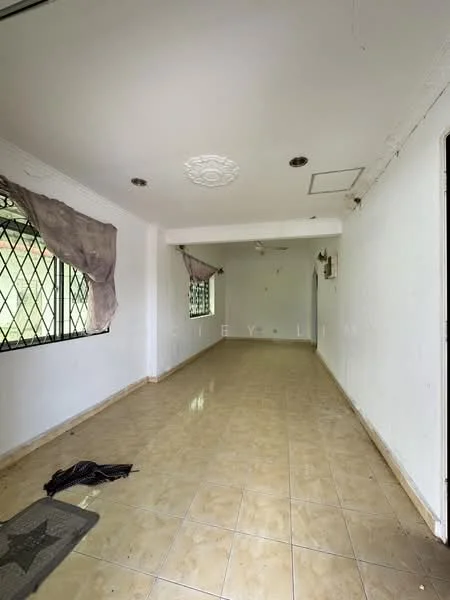
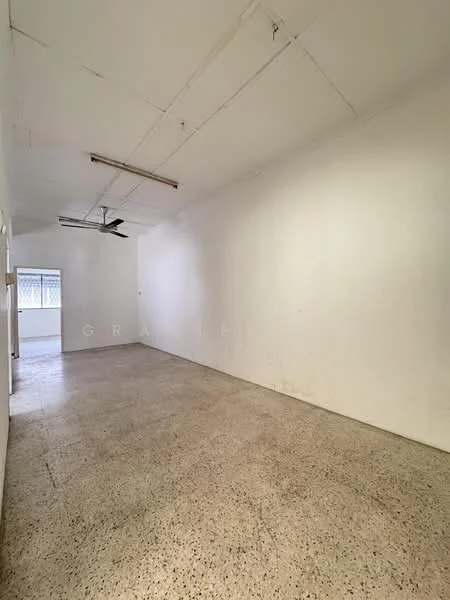
Taman Bagan Lallang, Taman Bagan Lalang, ButterworthTaman Bagan Lallang — for Rent
1 of 5
Price
RM1,200
Bedroom

3
Bathroom

2
Room type
Whole unit
Built-up
1,200 sqft
Get the latest offer for this unit
Home details
Type
Terrace
Title
Residential
Tenure
Freehold
Room type
Whole unit
Furnishing
Unfurnished
Built-up size
1,200 sqft
Facilities
Ground floor / Common Area
1
Playground
2
Security Guards
3
Parking
Nearby points of interest
Crime intelligence
ModerateIPD Seberang Perai Utara · 2023
Total crimes (2023)
696
convictions
vs. Pulau Pinang avg
+0%
above state median
Most common
Break in
29% of total
Density — crimes per 100k residents
198
per 100k · population ~351,000
This district
198
Pulau Pinang median
198
Coverage area
Butterworth, Kepala Batas, Tasek Gelugor, Penaga
IPD boundaries do not correspond to neighbourhood or administrative boundaries
Crimes by category (2023 convictions)
Break in
204
Theft other
163
Theft vehicle motorcycle
160
Causing injury
45
Robbery gang unarmed
43
Annual trend (IPD Seberang Perai Utara)
943
2019
714
2020
710
2021
689
2022
696
2023
District crime index
56 / 100 · 40th percentile in Pulau Pinang
Low
Moderate
High
Conviction-based data from PDRM — not reported incidents. Unreported crimes may not be reflected. Police district boundaries differ from administrative mukim boundaries.
Source: Royal Malaysian Police (PDRM) via data.gov.my · CC BY 4.0
Flood risk
Moderate riskTwo methods combined — river (fluvial) flooding from the closest river, and heavy-rain (pluvial) flash flooding from the surrounding terrain and rainfall. The badge above is the higher of the two.
River (fluvial)
Moderate
Heavy rain (pluvial)
Moderate
Moderate flood risk to this building
Nearest river shows moderate flood activity, but the building ground sits ≈0 m above it. River flooding could reach this building in an extreme event — the nearest river would need to rise about 1 floor.
Covers river flooding only — flash floods from heavy rain or blocked drains can still affect higher ground. Elevations are approximate (~90 m resolution).
River discharge — water flowing through the nearest river, not the building · activity moderate
Current discharge
15.8 m³/s
Elevated
Mean discharge
8.9 m³/s
30-day average
Max discharge
30.7 m³/s
30-day peak
Height above sea level
This building
≈4 m
Nearest river
257 m away
≈4 m
Building is about level with the nearest river
River overflow history — when the river flooded, not the building
River last flooded
No recent floods
Past 2 years
River floods
None recorded
Past 2 years
Monthly river flood risk
Jan
Feb
Mar
Apr
May
Jun
Jul
Aug
Sep
Oct
Nov
Dec
Low
Moderate
High (monsoon)
DID InfoBanjir tracks water levels in real time. Set up alerts at publicinfobanjir.water.gov.my
Source: Jabatan Pengairan dan Saliran (DID) Malaysia · Open-Meteo