New projects
Subsales
Rentals
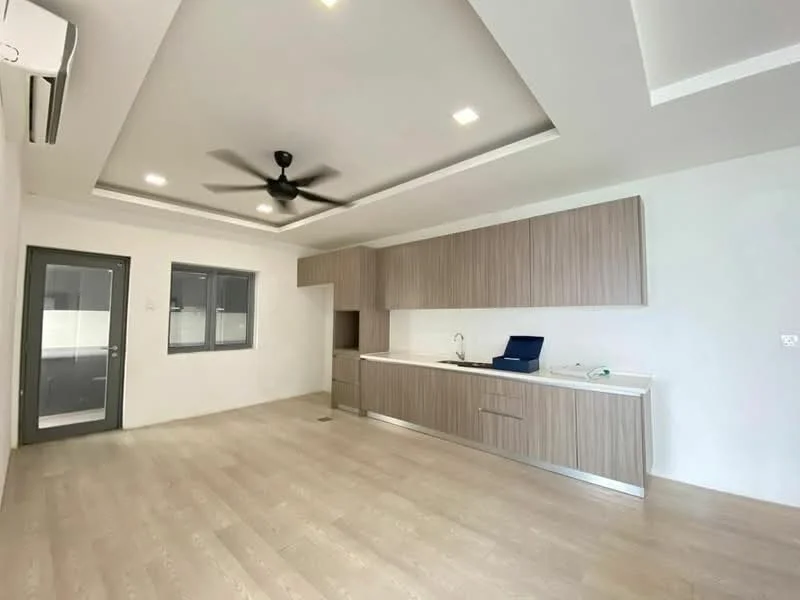
Lakefront Residence, CyberjayaLakefront Residence — for Sale
1 of 5
Price
RM555,000
Bedroom

3
Bathroom

2
Built-up
1,400 sqft
Carpark

2
Get the latest offer for this unit
Home details
Price per sqft
RM396.43 psf
Built-up size
1,400 sqft
Carparks
2
Furnished
Yes
Title
Strata
Tenure
Freehold
Type
Condominium
Facilities
Common Facilities
1
24-hour security
2
Adventure zone
3
Aquatic garden
4
Aquatoriums
5
Art garden
6
Badminton Court
Nearby points of interest
- school
SJK (C) Union, Cyberjaya
663 m
- school
SK Taman Putra Perdana
1.4 km
- school
Korean School of Malaysia
1.5 km
- school
SMK Putra Perdana
1.6 km
- school
SK Cyberjaya
1.7 km
- school
SMK Cyberjaya
1.8 km
- school
elc International School Cyberjaya Campus
2.0 km
- school
King Henry VIII College
2.1 km
- school
Sekolah Rendah Agama Taman Putra Perdana
2.2 km
- school
SK Taman Putra Perdana 2
2.3 km
1–5 of 10
Market intelligence
17 transactionsLAKEFRONT RESIDENCE @ CYBERJAYA · Sepang
RM 396.43 psf
This listing
-21.4%vs project median
RM 366
RM 504 (median)
RM 605
Cheapest in project
Most expensive
Median PSF
504.33
RM per sq.ft
Median price
570K
24-month median
PSF trend
-5.8%
12-month change
PSF by floor level
L1-5
RM493.16
(4)
L6-10
RM475.07
(2)
L11-15
RM537.18
(2)
L16-20
RM521.45
(1)
L21-25
RM604.92
(2)
L26-30
RM455.83
(4)
L36-40
RM365.89
(2)
Source: NAPIC (National Property Information Centre) · Sepang
Crime intelligence
LowIPD Sepang · 2023
Total crimes (2023)
712
convictions
vs. Selangor avg
−19%
below state median
Most common
Theft other
45% of total
Density — crimes per 100k residents
205
per 100k · population ~347,000
This district
205
Selangor median
253
Coverage area
Sepang, KLIA, Cyberjaya, Dengkil, Salak
IPD boundaries do not correspond to neighbourhood or administrative boundaries
Crimes by category (2023 convictions)
Theft other
320
Theft vehicle motorcycle
109
Break in
92
Causing injury
54
Robbery gang unarmed
42
Annual trend (IPD Sepang)
678
2019
571
2020
550
2021
627
2022
712
2023
District crime index
40 / 100 · 33rd percentile in Selangor
Low
Moderate
High
Conviction-based data from PDRM — not reported incidents. Unreported crimes may not be reflected. Police district boundaries differ from administrative mukim boundaries.
Source: Royal Malaysian Police (PDRM) via data.gov.my · CC BY 4.0
Flood risk
Low riskBased on the closest river — its water level and flow, not your exact unit. Every reading below tracks the river flooding, not the building, and your ground may sit higher or lower than the river itself.
Low flood risk to this building
Nearest river shows low flood activity, but the building ground sits ≈3 m above it. River flooding reaching this building is very unlikely — the nearest river would have to rise about 1 floor first.
Covers river flooding only — flash floods from heavy rain or blocked drains can still affect higher ground. Elevations are approximate (~90 m resolution).
River discharge — water flowing through the nearest river, not the building · activity low
Current discharge
N/A
Normal
Mean discharge
N/A
30-day average
Max discharge
N/A
30-day peak
Height above sea level
This building
≈17 m
Nearest river
279 m away
≈14 m
Building sits ≈3 m above the nearest river
River overflow history — when the river flooded, not the building
River last flooded
No recent floods
Past 2 years
River floods
None recorded
Past 2 years
Monthly river flood risk
Jan
Feb
Mar
Apr
May
Jun
Jul
Aug
Sep
Oct
Nov
Dec
Low
Moderate
High (monsoon)
DID InfoBanjir tracks water levels in real time. Set up alerts at publicinfobanjir.water.gov.my
Source: Jabatan Pengairan dan Saliran (DID) Malaysia · Open-Meteo