New projects
Subsales
Rentals
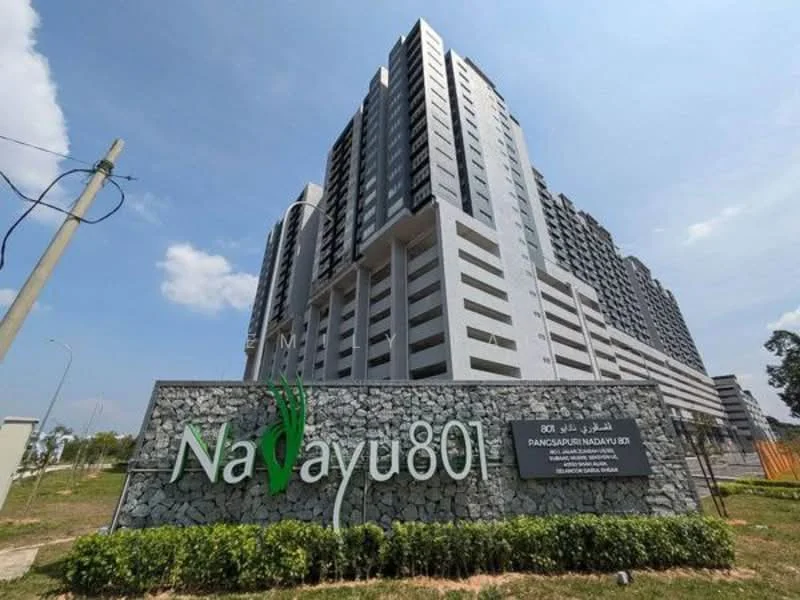
Nadayu 801, Shah AlamNadayu 801 — for Sale
1 of 5
Price
RM279,000
Bedroom

3
Bathroom

2
Built-up
1,079 sqft
Carpark

2
Get the latest offer for this unit
Home details
Price per sqft
RM258.57 psf
Built-up size
1,079 sqft
Carparks
2
Furnished
No
Title
Strata
Tenure
Leasehold
Type
Apartment
Facilities
Ground Floor
1
18 Retail Shops
Level 1 (Facilities Deck)
1
Swimming Pool
2
Wading Pool
3
Multipurpose Hall with 4 Badminton Courts
4
Double-volume Gymnasium
5
Playground
6
Garden Deck
Rooftop (Level 8+)
1
Rooftop Reading Lounge
2
Sky Lounge
3
Roof Deck Gardens
4
The Lounge (Indoor)
5
Co-working space
6
Discussion Pod
Nearby points of interest
- school
Sekolah Kebangssan Subang Perdana
1.2 km
- school
Sekolah Kebangsaan Subang Bestari
1.2 km
- school
Maahad Tahfiz Dar Tarim
1.4 km
- school
Young Muslim Centre
1.4 km
- school
Sekolah Rendah Islam As-Sakinah
1.4 km
- school
Dunia Bestari Tuition
1.5 km
- school
SRITI Subang
1.5 km
- school
Sekolah Rendah Integrasi Teras Islam Subang
1.6 km
- school
Bilik Makmal Biologi 1
1.6 km
- school
Blok Akademik 'B'
1.6 km
1–5 of 10
Market intelligence
26 transactionsTAMAN NADAYU · Gombak
RM 258.57 psf
This listing
-52.0%vs project median
RM 295
RM 539 (median)
RM 819
Cheapest in project
Most expensive
Median PSF
538.67
RM per sq.ft
Median price
530K
24-month median
PSF trend
N/A
No transaction within 12 months
PSF by floor level
L6-10
RM589.52
(6)
L11-15
RM653.51
(4)
L16-20
RM538.67
(2)
L21-25
RM484.05
(6)
L26-30
RM444.08
(2)
Source: NAPIC (National Property Information Centre) · Gombak
Crime intelligence
ModerateIPD Shah Alam · 2023
Total crimes (2023)
792
convictions
vs. Selangor avg
−10%
below state median
Most common
Theft vehicle motorcycle
31% of total
Density — crimes per 100k residents
120
per 100k · population ~660,000
This district
120
Selangor median
133
Coverage area
Shah Alam
IPD boundaries do not correspond to neighbourhood or administrative boundaries
Crimes by category (2023 convictions)
Theft vehicle motorcycle
248
Theft other
154
Break in
119
Theft vehicle motorcar
65
Causing injury
54
Annual trend (IPD Shah Alam)
1112
2019
866
2020
853
2021
782
2022
792
2023
District crime index
45 / 100 · 40th percentile in Selangor
Low
Moderate
High
Conviction-based data from PDRM — not reported incidents. Unreported crimes may not be reflected. Police district boundaries differ from administrative mukim boundaries.
Source: Royal Malaysian Police (PDRM) via data.gov.my · CC BY 4.0
Flood risk
Low riskBased on the closest river — its water level and flow, not your exact unit. Every reading below tracks the river flooding, not the building, and your ground may sit higher or lower than the river itself.
Low flood risk to this building
Nearest river shows low flood activity, but the building ground sits ≈3 m above it. River flooding reaching this building is very unlikely — the nearest river would have to rise about 1 floor first.
Covers river flooding only — flash floods from heavy rain or blocked drains can still affect higher ground. Elevations are approximate (~90 m resolution).
River discharge — water flowing through the nearest river, not the building · activity low
Current discharge
N/A
Normal
Mean discharge
N/A
30-day average
Max discharge
N/A
30-day peak
Height above sea level
This building
≈38 m
Nearest river
936 m away
≈35 m
Building sits ≈3 m above the nearest river
River overflow history — when the river flooded, not the building
River last flooded
No recent floods
Past 2 years
River floods
None recorded
Past 2 years
Monthly river flood risk
Jan
Feb
Mar
Apr
May
Jun
Jul
Aug
Sep
Oct
Nov
Dec
Low
Moderate
High (monsoon)
DID InfoBanjir tracks water levels in real time. Set up alerts at publicinfobanjir.water.gov.my
Source: Jabatan Pengairan dan Saliran (DID) Malaysia · Open-Meteo