New projects
Subsales
Rentals
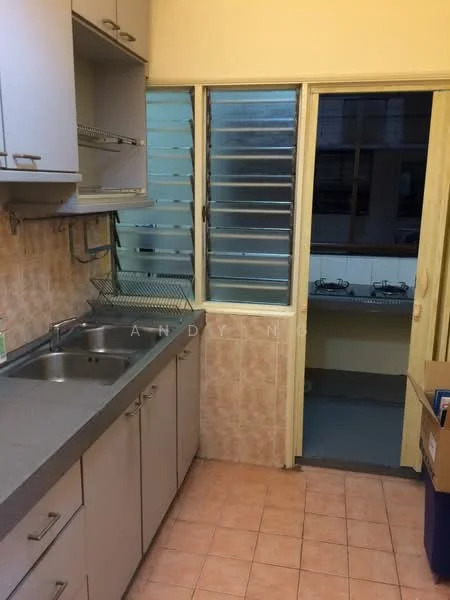
Pangsapuri Saraka, Taman Wawasan, PuchongPangsapuri Saraka — for Sale
1 of 5
Price
RM280,000
Bedroom

3
Bathroom

2
Built-up
904 sqft
Carpark

1
Get the latest offer for this unit
Home details
Price per sqft
RM309.73 psf
Built-up size
904 sqft
Carparks
1
Furnished
Yes
Title
Strata
Tenure
Freehold
Type
Apartment
Bumi reserved
No
Facilities
Common Facilities
1
Children Playground
2
Barbeque Area
3
Jogging Track
4
Mini Market
5
Lounge
6
Nursery
Nearby points of interest
- school
Sekolah Kebangsaan Pusat Bandar Puchong 2
325 m
- school
Sekolah Agama KAFA Integrasi Al-Husna
567 m
- school
Sekolah Menengah Kebangsaan Pusat Bandar Puchong (1)
668 m
- school
Sekolah Kebangsaan Pusat Bandar Puchong (1)
788 m
- school
Sekolah Jenis Kebangsaan (Cina) Kheng Chee
1.1 km
- school
Sekolah Jenis Kebangsaan (Cina) Shin Cheng (Harcroft)
1.1 km
- school
KAFA Integrasi Al-Firdaus
1.3 km
- school
SMK Bandar Puchong Jaya (B)
1.4 km
- school
SAM Singapore Maths Bandar Puteri Puchong
1.4 km
- school
SMK Seksyen 3 Bandar Kinrara
1.8 km
1–5 of 10
Market intelligence
4 transactionsPANGSAPURI SARAKA-PST BDR PUCHONG · Petaling
RM 309.73 psf
This listing
-18.0%vs project median
RM 319
RM 378 (median)
RM 437
Cheapest in project
Most expensive
Median PSF
377.85
RM per sq.ft
Median price
344K
24-month median
PSF trend
N/A
No transaction within 12 months
PSF by floor level
L1-5
RM318.52
(2)
L11-15
RM437.19
(2)
Source: NAPIC (National Property Information Centre) · Petaling
Crime intelligence
HighIPD Petaling Jaya · 2023
Total crimes (2023)
1,472
convictions
vs. Selangor avg
+68%
above state median
Most common
Theft other
27% of total
Density — crimes per 100k residents
226
per 100k · population ~650,000
This district
226
Selangor median
135
Coverage area
Petaling Jaya, Kelana Jaya, Damansara
IPD boundaries do not correspond to neighbourhood or administrative boundaries
Crimes by category (2023 convictions)
Theft other
400
Break in
327
Theft vehicle motorcycle
292
Theft vehicle motorcar
123
Causing injury
96
Annual trend (IPD Petaling Jaya)
3116
2019
2601
2020
1740
2021
1566
2022
1472
2023
District crime index
83 / 100 · 80th percentile in Selangor
Low
Moderate
High
Conviction-based data from PDRM — not reported incidents. Unreported crimes may not be reflected. Police district boundaries differ from administrative mukim boundaries.
Source: Royal Malaysian Police (PDRM) via data.gov.my · CC BY 4.0
Flood risk
Moderate riskBased on the closest river — its water level and flow, not your exact unit. Every reading below tracks the river flooding, not the building, and your ground may sit higher or lower than the river itself.
Moderate flood risk to this building
Nearest river shows low flood activity, but the building ground sits ≈74 m below it. This building sits below the nearest river, so river flooding is a real concern — check drainage and past flooding closely.
Covers river flooding only — flash floods from heavy rain or blocked drains can still affect higher ground. Elevations are approximate (~90 m resolution).
River discharge — water flowing through the nearest river, not the building · activity low
Current discharge
N/A
Normal
Mean discharge
N/A
30-day average
Max discharge
N/A
30-day peak
Height above sea level
This building
≈59 m
Nearest river
611 m away
≈133 m
Building sits ≈74 m below the nearest river
River overflow history — when the river flooded, not the building
River last flooded
No recent floods
Past 2 years
River floods
None recorded
Past 2 years
Monthly river flood risk
Jan
Feb
Mar
Apr
May
Jun
Jul
Aug
Sep
Oct
Nov
Dec
Low
Moderate
High (monsoon)
DID InfoBanjir tracks water levels in real time. Set up alerts at publicinfobanjir.water.gov.my
Source: Jabatan Pengairan dan Saliran (DID) Malaysia · Open-Meteo