
New projects
Subsales
Rentals
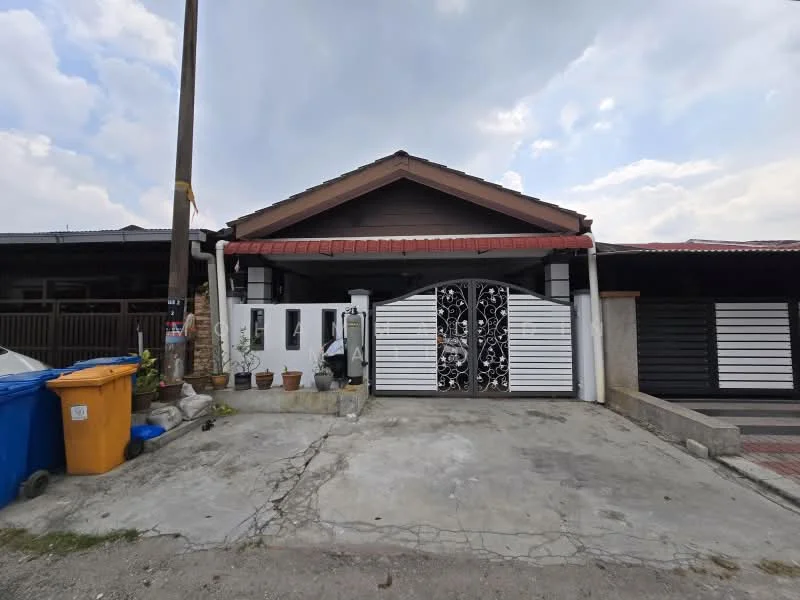
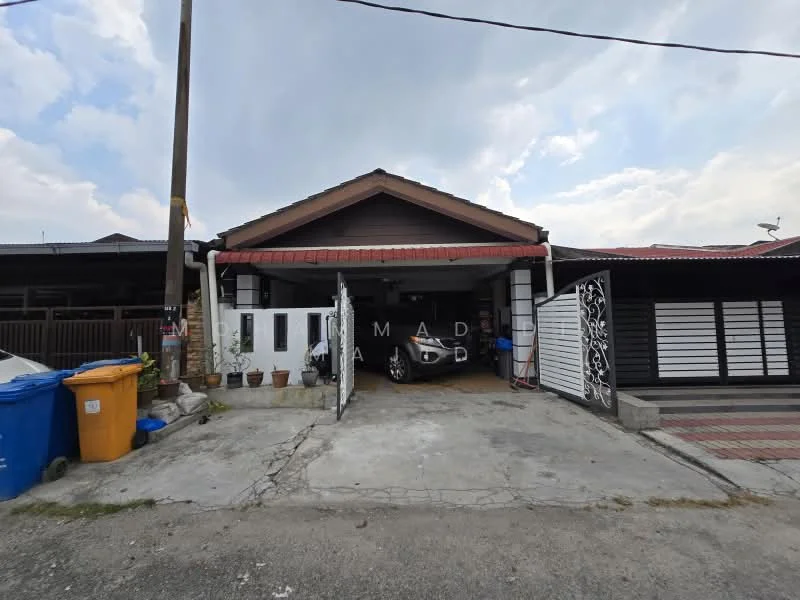
Seksyen 35, Taman Desa Kemuning, Seksyen 35, Taman Desa Kemuning, Shah Alamfor Sale
1 of 5
Price
RM340,000
Bedroom

4
Bathroom

3
Built-up
1,400 sqft
Get the latest offer for this unit
Home details
Price per sqft
RM242.86 psf
Built-up size
1,400 sqft
Land size
1,400 sq.ft
Furnishing
Unfurnished
Title
Individual
Tenure
Leasehold
Type
Terrace
Bumi reserved
Yes
Nearby points of interest
Market intelligence
113 nearby sales113 comparable terrace sales within 3km · similar size · last 24 months
RM 387.65 psf
Area median
-37.4%this listing vs area
RM 332
RM 453
Lower quartile
Upper quartile
This listing asks RM 242.86 psf.
Comparable sales near this listing, not a valuation of this building.
Source: NAPIC (National Property Information Centre)
Crime intelligence
ModerateIPD Shah Alam · 2023
Total crimes (2023)
792
convictions
vs. Selangor avg
−10%
below state median
Most common
Theft vehicle motorcycle
31% of total
Density — crimes per 100k residents
120
per 100k · population ~660,000
This district
120
Selangor median
133
Coverage area
Shah Alam
IPD boundaries do not correspond to neighbourhood or administrative boundaries
Crimes by category (2023 convictions)
Theft vehicle motorcycle
248
Theft other
154
Break in
119
Theft vehicle motorcar
65
Causing injury
54
Annual trend (IPD Shah Alam)
1112
2019
866
2020
853
2021
782
2022
792
2023
District crime index
45 / 100 · 40th percentile in Selangor
Low
Moderate
High
Conviction-based data from PDRM — not reported incidents. Unreported crimes may not be reflected. Police district boundaries differ from administrative mukim boundaries.
Source: Royal Malaysian Police (PDRM) via data.gov.my · CC BY 4.0
Flood risk
Moderate riskTwo methods combined — river (fluvial) flooding from Sungai Kandis, the closest river, and heavy-rain (pluvial) flash flooding from the surrounding terrain and rainfall. The badge above is the higher of the two.
River (fluvial)
Moderate
Heavy rain (pluvial)
Moderate
Moderate flood risk to this building
Sungai Kandis shows high flood activity, but the building ground sits ≈2 m above it. River flooding could reach this building in an extreme event — Sungai Kandis would need to rise about 1 floor.
Covers river flooding only — flash floods from heavy rain or blocked drains can still affect higher ground. Elevations are approximate (~90 m resolution).
River discharge — water flowing through Sungai Kandis, not the building · activity high
Current discharge
41.1 m³/s
Above threshold
Mean discharge
47.3 m³/s
30-day average
Max discharge
262.6 m³/s
30-day peak
Height above sea level
This building
≈8 m
Sungai Kandis
167 m away
≈6 m
Building is about level with Sungai Kandis
Sungai Kandis overflow history — when the river flooded, not the building
River last flooded
7 Jun 2026
River ran ≈2.2× normal (≈46 m³/s)
Past 2 years
River floods
1 event
Past 2 years
Monthly river flood risk
Jan
Feb
Mar
Apr
May
Jun
Jul
Aug
Sep
Oct
Nov
Dec
Low
Moderate
High (monsoon)
DID InfoBanjir tracks water levels in real time. Set up alerts at publicinfobanjir.water.gov.my
Source: Jabatan Pengairan dan Saliran (DID) Malaysia · Open-Meteo