New projects
Subsales
Rentals
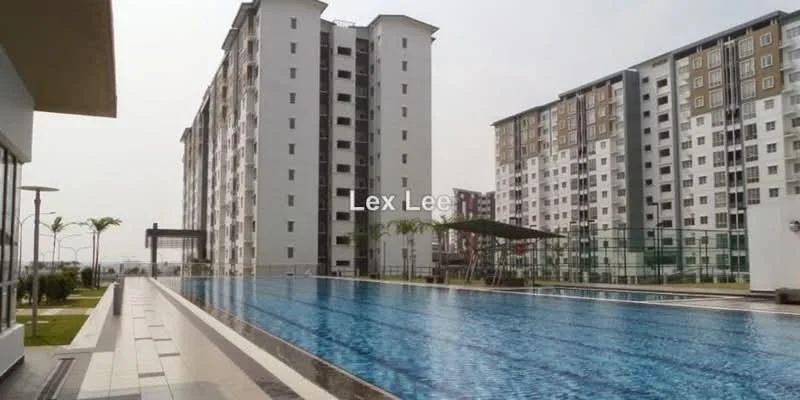
Seri Baiduri, Setia AlamSeri Baiduri Apartments — for Sale
1 of 5
Price
RM300,000
Bedroom

3
Bathroom

2
Built-up
920 sqft
Carpark

2
Get the latest offer for this unit
Home details
Price per sqft
RM326.09 psf
Built-up size
920 sqft
Carparks
2
Furnished
Yes
Title
Strata
Tenure
Freehold
Type
Apartment
Bumi reserved
No
Facilities
Ground Floor / Common Facilities
1
Swimming pool
2
Children pool
3
Gymnasium
4
Multi-purpose hall
5
Badminton courts
6
Futsal courts
Nearby points of interest
- school
Peninsula International School
2.7 km
- school
Sekolah Kebangsaan Meru (2)
3.1 km
- school
SMK Meru
3.8 km
- school
SJK (C) Tiong Hua Kok Bin
3.9 km
- school
SK Sungai Binjai
4.0 km
- school
SJK (T) Ladang Hammock
4.1 km
- school
SMK Setia Alam
4.2 km
- school
SK Setia Alam
4.3 km
- school
Seven Skies Islamic School
4.5 km
- school
SK Denai Alam
5.2 km
1–5 of 10
Market intelligence
42 transactionsSERI JATI & BAIDURI-BDR SETIA ALAM · Petaling
RM 326.09 psf
This listing
-13.8%vs project median
RM 318
RM 378 (median)
RM 486
Cheapest in project
Most expensive
Median PSF
378.09
RM per sq.ft
Median price
330K
24-month median
PSF trend
-12.8%
12-month change
PSF by floor level
L1-5
RM402.25
(16)
L6-10
RM356.49
(26)
Source: NAPIC (National Property Information Centre) · Petaling
Crime intelligence
ModerateIPD Shah Alam · 2023
Total crimes (2023)
792
convictions
vs. Selangor avg
−10%
below state median
Most common
Theft vehicle motorcycle
31% of total
Density — crimes per 100k residents
120
per 100k · population ~660,000
This district
120
Selangor median
133
Coverage area
Shah Alam
IPD boundaries do not correspond to neighbourhood or administrative boundaries
Crimes by category (2023 convictions)
Theft vehicle motorcycle
248
Theft other
154
Break in
119
Theft vehicle motorcar
65
Causing injury
54
Annual trend (IPD Shah Alam)
1112
2019
866
2020
853
2021
782
2022
792
2023
District crime index
45 / 100 · 40th percentile in Selangor
Low
Moderate
High
Conviction-based data from PDRM — not reported incidents. Unreported crimes may not be reflected. Police district boundaries differ from administrative mukim boundaries.
Source: Royal Malaysian Police (PDRM) via data.gov.my · CC BY 4.0
Flood risk
High riskBased on the closest river — its water level and flow, not your exact unit. Every reading below tracks the river flooding, not the building, and your ground may sit higher or lower than the river itself.
High flood risk to this building
Nearest river shows high flood activity, but the building ground sits ≈14 m below it. River flooding is a real risk for this building — it sits below the nearest river.
Covers river flooding only — flash floods from heavy rain or blocked drains can still affect higher ground. Elevations are approximate (~90 m resolution).
River discharge — water flowing through the nearest river, not the building · activity high
Current discharge
1.8 m³/s
Above threshold
Mean discharge
1.3 m³/s
30-day average
Max discharge
12.5 m³/s
30-day peak
Height above sea level
This building
≈31 m
Nearest river
492 m away
≈45 m
Building sits ≈14 m below the nearest river
River overflow history — when the river flooded, not the building
River last flooded
7 Jun 2026
River ran ≈3.1× normal (≈3 m³/s)
Past 2 years
River floods
5 events
Past 2 years
Monthly river flood risk
Jan
Feb
Mar
Apr
May
Jun
Jul
Aug
Sep
Oct
Nov
Dec
Low
Moderate
High (monsoon)
DID InfoBanjir tracks water levels in real time. Set up alerts at publicinfobanjir.water.gov.my
Source: Jabatan Pengairan dan Saliran (DID) Malaysia · Open-Meteo